Introduction
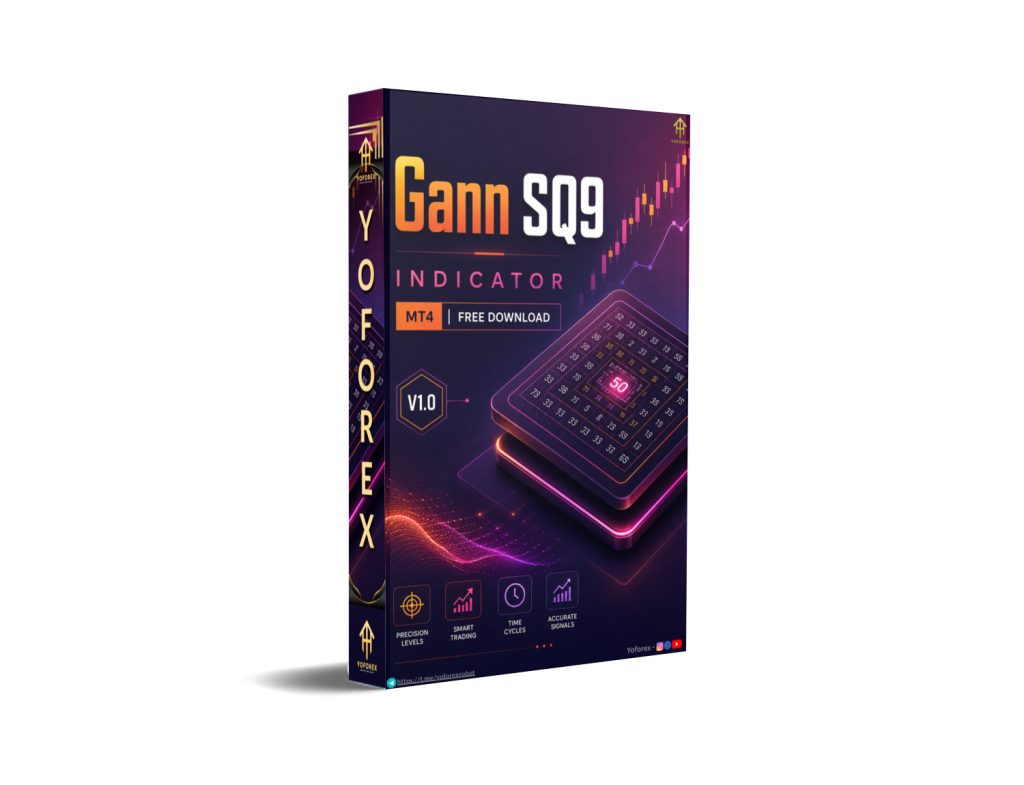
In the vast universe of technical analysis, few tools have maintained an aura of mystique and reverence quite like the methodologies developed by W.D. Gann. For decades, traders have been captivated by the precision and mathematical elegance of Gann’s theories. Today, with the evolution of trading technology, these complex concepts have been distilled into accessible formats for modern traders. One such powerful tool is the Gann SQ9 INDICATOR V1.0 for MetaTrader 4.
The Gann SQ9 INDICATOR V1.0 represents a significant advancement in bringing W.D. Gann’s legendary Square of Nine calculations to the fingertips of every retail trader. This indicator serves as a bridge between the intricate world of geometric trading and the practical demands of everyday market analysis. By automating the complex calculations behind Gann’s methodologies, it empowers traders to identify high-probability support and resistance zones, anticipate potential reversal points, and align their strategies with the natural mathematical rhythms of the market .
This comprehensive blog post explores every facet of the Gann SQ9 INDICATOR V1.0, from its core trading logic to practical implementation strategies. Whether you are a seasoned trader seeking to refine your approach or a curious newcomer intrigued by Gann’s methods, this guide will provide valuable insights into harnessing the power of the Square of Nine in your trading journey.
Understanding the Foundation: What is the Gann SQ9 Indicator?
At its core, the Gann SQ9 INDICATOR V1.0 is built upon the foundational principles of W.D. Gann’s Square of Nine, one of the most revered tools in the Gann trading arsenal. The Square of Nine is more than just a mathematical curiosity; it represents Gann’s belief in the inherent cyclical and geometric nature of financial markets.
The Square of Nine is constructed by arranging numbers in a spiral around a central point, with increments radiating outward. Each complete rotation of the spiral (360 degrees) corresponds to a change in the square root of the number by 2. This simple but profound relationship reveals that numbers positioned at specific angles—such as 0, 90, 180, and 270 degrees (the cardinal cross) or 45, 135, 225, and 315 degrees (the diagonal cross)—possess unique significance as potential support and resistance levels .
The Gann SQ9 INDICATOR V1.0 leverages these principles by automatically plotting critical levels derived from the Square of Nine based on a selected anchor point. This anchor point is typically a significant high or low pivot in the market’s price action. By doing so, the indicator creates a dynamic map of potential turning points, allowing traders to anticipate where price might encounter resistance or find support .
Overview of the Gann SQ9 INDICATOR V1.0
The Gann SQ9 INDICATOR V1.0 is a sophisticated technical analysis tool for the MetaTrader 4 platform. Its primary purpose is to identify “strong time and price zones” by translating the principles of the Square of Nine into a visual, interactive format . It removes the manual labor and guesswork traditionally associated with calculating Gann levels, enabling traders to focus on strategy and execution.
Core Functionality
The indicator presents Gann levels on your trading chart as horizontal lines representing key degrees. These levels are not static; they are calculated based on the starting point you define, which anchors the entire analysis. The Gann SQ9 INDICATOR V1.0 offers two primary calculation modes :
-
Local Calculation: This mode allows you to calculate the relationship between two specific points on your chart. You select a starting point and an ending point (either historical or projected into the future), and the indicator calculates the number of degrees the price has traversed in price or time. This provides a precise measure of the geometric relationship between market events .
-
Grid Calculation (Time_Ex and Price_Ex): This mode projects a full grid of Gann levels from a single selected starting point. Once you specify the anchor extreme, the indicator immediately draws the corresponding levels radiating from that point. This is particularly useful for identifying broader support and resistance zones in the market .
User Interface and Ease of Use
The Gann SQ9 INDICATOR V1.0 features a user-friendly interface designed to simplify complex analysis. Upon attaching the indicator to your chart, a menu button appears. This menu provides easy access to all the indicator’s key functions :
- Time Button: For local time calculations.
- Price Button: For local price calculations.
- Time_Ex Button: For time grid calculations.
- Price_Ex Button: For price grid calculations.
- Cleaner All Button: To clear all drawings from the chart, allowing for a fresh analysis .
The menu is fully interactive and can be moved around the chart for convenience. Double-clicking on the menu button toggles its highlight, revealing or hiding the sub-menus for each function .
How the Gann SQ9 INDICATOR V1.0 Works
Understanding the mechanics of the Gann SQ9 INDICATOR V1.0 is crucial for using it effectively. The indicator’s operation is built on a few key principles that translate Gann’s complex theories into actionable chart data.
The Principle of the Square of Nine
The indicator is fundamentally driven by the Square of Nine spiral. The formula for calculating the next price level in the spiral is:
Square Root of Price + Increment² = Next Price
The increment is determined by the angle of interest. For example, a 45-degree angle corresponds to an increment of 0.25 (since 360 degrees = 2, so 45 degrees = 0.25), and a 180-degree angle corresponds to an increment of 1. The Gann SQ9 INDICATOR V1.0 applies this formula based on your chosen anchor point, automatically generating a series of levels that correspond to the cardinal and diagonal crosses of the Square of Nine .
How to Apply the Indicator
The process of using the Gann SQ9 INDICATOR V1.0 can be broken down into two main methods, as previously mentioned :
-
For a Local Calculation:
-
Click the Time button for a time-based calculation, or Price for a price-based one.
-
Click once on the chart to mark the starting extreme (beginning point).
-
Click twice on the second extreme (end point) if you are analyzing historical data. Alternatively, click twice at the point in the future where you expect a price or time reaction to occur.
-
The indicator will draw a line connecting the points and display the number of degrees the price moved in time or price .
-
-
For a Grid Calculation:
-
Click the Time_Ex button (for a time grid) or Price_Ex button (for a price grid).
-
Click once on the selected starting extreme. The indicator will instantly draw the full grid of Gann levels extending from that point .
-
This intuitive process allows you to quickly generate and test different Gann scenarios on your chart, providing valuable insights into market dynamics.
Key Features of the Gann SQ9 INDICATOR V1.0
The Gann SQ9 INDICATOR V1.0 is packed with features designed to enhance the analytical capabilities of traders. Here are its standout attributes:
1. Dual Calculation Methods (Local & Grid)
As detailed earlier, the ability to perform both local calculations and grid projections provides a versatile toolkit. You can examine the geometric relationship between two specific points or visualize a comprehensive web of potential support and resistance levels .
2. Time and Price Projection
The indicator seamlessly integrates both time and price analysis. It acknowledges that market structure is not just about price levels but also about timing. By providing separate functions for Time and Price, it allows traders to uncover “time-price squaring”—a concept central to Gann’s work, where a significant price level and a specific time converge .
3. Interactive Menu and User Interface
The floating menu button allows you to easily switch between functions and clear the chart. The ability to toggle the menu’s highlight and move it around means the interface is non-intrusive and user-friendly .
4. Customizable Degree Settings
The indicator displays levels as degree values, and these degrees can be configured in the settings. This gives you control over the granularity of the levels plotted .
5. Compatibility with Multiple Instruments
The Gann SQ9 INDICATOR V1.0 is versatile and can be used on forex, indices, stocks, commodities, and cryptocurrencies. This universality is due to the inherent nature of the Square of Nine, which applies across different financial markets .
6. Non-Repainting Nature
One of the most critical features for any technical indicator is reliability. The Gann SQ9 INDICATOR V1.0 is known not to repaint, meaning its signals and levels remain stable once plotted. This stability is essential for backtesting and for making real-time trading decisions with confidence .
Trading Strategy Logic Used by the Gann SQ9 INDICATOR V1.0
The Gann SQ9 INDICATOR V1.0 provides the foundational elements for a powerful price-action strategy. The core logic is simple yet profound: price is drawn magnetically toward Gann levels.
Core Strategy Principle
The strategy revolves around identifying when price approaches a Gann level derived from a significant high or low. These levels are not merely arbitrary lines; they represent mathematically significant zones where the market is likely to react. The logic is based on the following premise :
- Support and Resistance: Gann levels act as natural barriers for price movement.
- Reversal Zones: The strongest reactions are expected at the cardinal crosses (0°, 90°, 180°, 270°) and diagonal crosses (45°, 135°, 225°, 315°).
- Confluence: When a Gann price level aligns with a Gann time projection, the probability of a significant market turn increases dramatically.
Building a Trading Strategy
To construct a robust trading strategy using the Gann SQ9 INDICATOR V1.0, traders should follow these steps:
-
Identify the Anchor: The quality of the analysis hinges on the correct starting point. This is typically a significant swing high or low on a higher timeframe (e.g., Daily or 4-Hour). Use the indicator’s Price_Ex function from this anchor to plot the grid of levels .
-
Confirm the Trend: Use additional tools like moving averages or trendlines to establish the macro trend. The Gann levels are most effective when you trade in the direction of the dominant trend .
-
Look for Confluence: The best setups occur where a Gann price level aligns with another form of confluence, such as:
-
A Gann time projection.
-
A Fibonacci retracement level.
-
A previous support/resistance zone.
-
A trendline .
-
-
Entry: Enter the trade when price reaches a key Gann level and shows signs of a reaction (e.g., a bullish or bearish candlestick pattern).
-
Stop Loss and Take Profit:
-
Place your stop loss just beyond the Gann level to give the trade room to breathe.
-
Set your take profit at the next Gann level in the direction of the trend .
-
Time-Based Projections
Time is a critical component of the overall strategy. By using the Time_Ex function, traders can anticipate specific dates where the market might turn. If a projected time date coincides with price reaching a key Gann level, it forms a powerful confluence signal known as “time-price squaring” .
Recommended Settings for the Gann SQ9 INDICATOR V1.0
While the indicator is powerful out of the box, optimizing its settings for your specific trading style and instrument can significantly improve its effectiveness.
Timeframe Considerations
The Gann SQ9 INDICATOR V1.0 is effective on all timeframes. However, for higher-probability signals, consider these general guidelines:
- Higher Timeframes (4-Hour, Daily, Weekly): These provide more significant Gann levels that act as strong support and resistance. Swing traders and position traders often prefer these timeframes.
- Lower Timeframes (1-Hour, 30-Minute, 15-Minute): These are suitable for day traders and scalpers who need more frequent entry signals. Be aware that levels on lower timeframes might be more prone to being breached by market noise .
Adjusting Degree Angles
The number of levels displayed can be controlled by adjusting the angle settings. A smaller angle increment (like 22.5 degrees) will produce more levels, while a larger one (like 45 or 90 degrees) will show fewer, potentially stronger levels .
- For a broad view, you might start with the cardinal and diagonal crosses only (45-degree angles).
- For more granular detail, you can include the 22.5 and 67.5-degree levels.
Input Parameters
If you are using a variation of the Square of Nine indicator, pay attention to these common parameters:
- Angle: Sets the minimum angle for trend changes.
- kol_lev: Determines the number of levels to display. Increasing this number draws more levels but can clutter the chart.
- Sqrt Scale: Adjusts the spacing between levels. A higher value creates a wider spacing, suitable for ranges, while a lower value creates tighter spacing, suitable for intraday trading .
Backtesting the Gann SQ9 Indicator
Backtesting is an essential step in validating any trading strategy. The non-repainting nature of the Gann SQ9 INDICATOR V1.0 makes it highly suitable for reliable backtesting .
What to Look For in Backtesting
When testing strategies based on this indicator, focus on :
- Accuracy of Levels: Did the Gann levels accurately project support and resistance? Observe how often price reversed or paused at these levels.
- Success Rate: What was the win rate of trades taken at Gann levels?
- Risk-to-Reward Ratio: Evaluate the potential reward from a level to the next compared to the risk of a break.
A Word on Strategy Interpretation
Some backtesting results suggest that the conventional application of the Square of Nine might need to be adapted. One study found that taking the opposite trade of the traditional Gann signal could be more profitable . This suggests that the Gann SQ9 INDICATOR V1.0 might be used effectively as a “contrarian” tool, where one looks to fade moves that approach these extreme levels.
Installation Guide for the Gann SQ9 INDICATOR V1.0
Installing the Gann SQ9 INDICATOR V1.0 on your MetaTrader 4 platform is a straightforward process. Follow these steps:
Step 1: Download the Indicator Files
-
The indicator is typically provided as an
.ex4(compiled) or.mq4(source code) file.
Step 2: Open MetaTrader 4
-
Launch your MT4 trading platform.
Step 3: Open the Data Folder
-
Click on
Filein the top menu, then selectOpen Data Folder.
Step 4: Navigate to the Indicators Folder
-
In the Data Folder, open the
MQL4folder, and then open theIndicatorsfolder.
Step 5: Copy the Files
-
Copy the downloaded
.ex4and/or.mq4files into theIndicatorsfolder.
Step 6: Restart or Refresh
-
Restart MetaTrader 4 or, if it is already open, right-click in the Navigator window and select
Refresh.
Step 7: Attach the Indicator
-
In the Navigator window, find the indicator (it will be listed in the
Custom Indicatorssection). -
Drag and drop it onto your desired chart. The indicator’s settings window will pop up, allowing you to configure the inputs.
Advantages and Disadvantages of the Gann SQ9 INDICATOR V1.0
Every trading tool comes with its strengths and limitations. Understanding these will help you use the Gann SQ9 INDICATOR V1.0 more effectively.
Advantages
- Automation of Complex Analysis: It removes the need for complex manual calculations, saving time and reducing errors .
- Strong Mathematical Foundation: The indicator leverages the mathematical principles of the Square of Nine, which have a historical basis in market behavior .
- Time and Price Integration: It uniquely combines both time and price analysis, offering a more holistic view of the market .
- Customizable and Versatile: It works on various instruments and timeframes .
- Non-Repainting: The indicator provides stable and reliable data for analysis .
- Interactive and Visual: The intuitive menu makes it accessible to traders of all experience levels .
Disadvantages
- Subjectivity in Anchor Selection: Determining the most significant “starting point” can be subjective. The accuracy of the analysis heavily depends on this selection. Gann himself did not provide a strict mechanical rule for this .
- Potential for Clutter: Plotting too many levels can clutter the chart and make analysis difficult .
- Not a Standalone System: Like most indicators, it should be used in conjunction with other forms of analysis (e.g., price action, trend confirmation) for the best results .
- Requires Interpretation: The indicator provides levels, but their significance and the appropriate trading action require discretion and experience.
Who Should Use the Gann SQ9 Indicator?
The Gann SQ9 INDICATOR V1.0 is a versatile tool, but it is particularly well-suited for certain types of traders.
- Swing Traders: Those who hold positions for a few days to weeks can use the 4-Hour and Daily charts to identify significant reaction levels for entries and exits.
- Day Traders: By using the indicator on smaller timeframes, day traders can identify intraday support and resistance zones from the day’s open or from significant recent swings .
- Traders Interested in Confluence: If you enjoy using multiple techniques to identify high-probability setups, the Gann levels are an excellent source of confluence.
- Traders Looking for a Systematic Approach: The indicator provides a framework for objective analysis, reducing emotional decision-making.
- Advanced Traders Exploring Geometry: Those with an interest in market geometry and cyclical analysis will find the indicator to be a powerful tool.
Why Choose the Gann SQ9 Indicator Over Other Forex Robots?
When comparing the Gann SQ9 INDICATOR V1.0 to automated expert advisors (EAs) or “robots,” it’s essential to understand their fundamental differences.
1. Predictive vs. Reactive Analysis
Most EAs are reactive, generating signals based on historical price action (e.g., moving average crossovers, stochastic overbought/oversold). In contrast, the Gann SQ9 INDICATOR V1.0 is a predictive analytical tool. It projects future levels of support and resistance before price reaches them . This gives traders a proactive edge in planning their trades.
2. Adaptability and Versatility
EAs are often designed for a specific strategy and can perform poorly in changing market conditions. The Gann SQ9 INDICATOR V1.0 is a tool of analysis, not a fixed robot. It can be adapted to different trading styles, timeframes, and market conditions based on the trader’s interpretation and discretion.
3. User Control and Discretion
Using the indicator puts the trader back in control. You are the one choosing the anchor point, interpreting the levels, and deciding on entry/exit. This encourages a deeper understanding of the market, rather than relying on a “black box” algorithm.
4. No Over-Optimization Risk
Many EAs are victims of curve-fitting, where a strategy is “optimized” to perform perfectly in the past but fails in the future. The Gann SQ9 INDICATOR V1.0 is based on a fixed mathematical principle (the Square of Nine), making it immune to the perils of backtest over-optimization.
Conclusion
The Gann SQ9 INDICATOR V1.0 stands out as a sophisticated and powerful tool in the MetaTrader 4 ecosystem. By bringing the legendary Square of Nine calculations to a modern, interactive platform, it makes Gann’s complex theories accessible to traders of all levels. Its ability to identify significant time and price zones provides a unique, proactive edge that is difficult to find in standard technical indicators.
While the indicator is a potent analytical asset, its true strength lies in the hands of a discerning trader. The subjectivity of anchor selection and the need for additional confirmation highlight the importance of combining it with a robust understanding of price action and market context .
Whether you are a swing trader looking to pinpoint reversals or a day trader seeking intraday support and resistance, the Gann SQ9 INDICATOR V1.0 offers a valuable framework for making more informed and strategic trading decisions. Embrace its analytical power, respect its nuances, and integrate it into your trading plan to unlock a deeper understanding of the geometric structure of financial markets.
Support & Disclaimer
Support
If you need help installing or configuring your EA, or face any kind of bug, feel free to reach out on:
WhatsApp: Click here
Telegram Group: Join our community
Disclaimer:
Forex and gold trading involve risk. Past performance doesn’t guarantee future results. Always test robots on demo before live trading and use proper risk management.
REFERRAL
Join the VIP Signals Telegram Channel for real-time expert trading signals and stay ahead in the forex market. Get personalized strategies by becoming a part of our Real Account Management Telegram Channel and optimize your trading experience. If you’re aiming to Pass PropFirm Challenges , join our dedicated channel for tips and proven methods. Start managing your capital effectively with expert advice from our Funded Account Management Telegram Channel. For advanced traders, our HFT EA / Passing Telegram Channel offers high-frequency trading insights and strategies to boost your performance.