
DTFX Algo Zones Indicator V1.0 MT5 – Smart Market Structure Fibonacci Zones Explained
In modern forex trading, precision and context matter more than ever. Traders are no longer relying solely on traditional indicators; instead, they are shifting toward Smart Money Concepts (SMC) and market structure-based tools to identify high-probability trading zones. One such advanced tool is the DTFX Algo Zones Indicator V1.0 MT5.
This indicator automatically generates Fibonacci retracement zones based on market structure shifts, such as Break of Structure (BOS) and Change of Character (CHoCH). These zones act as dynamic support and resistance levels, helping traders identify areas where price is likely to react, bounce, or show weakness.
Designed for MetaTrader 5 users, the DTFX Algo Zones Indicator removes guesswork from Fibonacci drawing and aligns retracements with meaningful price action rather than arbitrary swing points.
What Is DTFX Algo Zones Indicator V1.0 MT5?
DTFX Algo Zones Indicator V1.0 MT5 is a market structure-driven Fibonacci retracement indicator that automatically plots retracement zones only after a confirmed structural shift occurs in the market.
Unlike manual Fibonacci tools, this indicator:
Draws retracements only from valid BOS or CHoCH events
Focuses on institutionally relevant price movements
Filters out low-quality or random retracement levels
The result is a clean, objective view of where price is likely to retrace and continue in the prevailing direction.
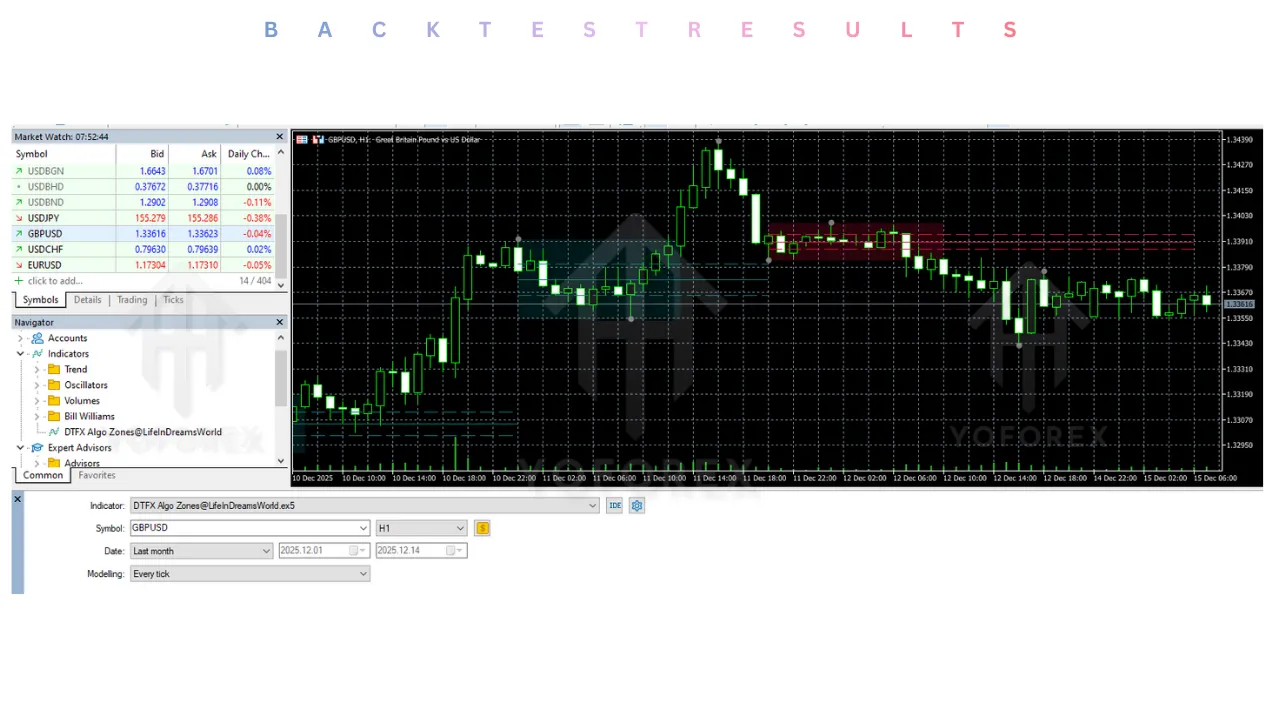
Core Concept: Market Structure Shifts
At the heart of the DTFX Algo Zones Indicator is SMC market structure logic.
Break of Structure (BOS)
A BOS occurs when price decisively breaks above or below a significant swing high or swing low, confirming continuation of trend strength.
Change of Character (CHoCH)
A CHoCH signals a potential trend reversal or shift in market behavior, indicating that control may be transferring from buyers to sellers or vice versa.
The indicator automatically identifies these events and uses them as anchors for Fibonacci retracement zones.
How the Retracement Zones Are Generated
When a market structure shift is detected:
Price breaks a key swing point (BOS or CHoCH)
The indicator identifies the point of break
It measures the highest or lowest price reached since that break
A Fibonacci retracement zone is drawn between these two points
Because this process requires confirmed price action, retracement zones are not always immediately tradable, but instead act as areas of interest for future price reactions.
Bullish vs Bearish Zone Logic
The Fibonacci calculation adapts automatically based on market direction:
Bullish Zone
Bottom of the zone = 0
Top of the zone = 1
Used when market structure shifts upward
Traders look for price to retrace downward into the zone and bounce
Bearish Zone
Top of the zone = 0
Bottom of the zone = 1
Used when market structure shifts downward
Traders watch for retracements upward into the zone for bearish confirmation
This dynamic calculation ensures Fibonacci levels always align correctly with trend direction.
How to Use DTFX Algo Zones Indicator
Step 1: Identify the Market Structure Shift
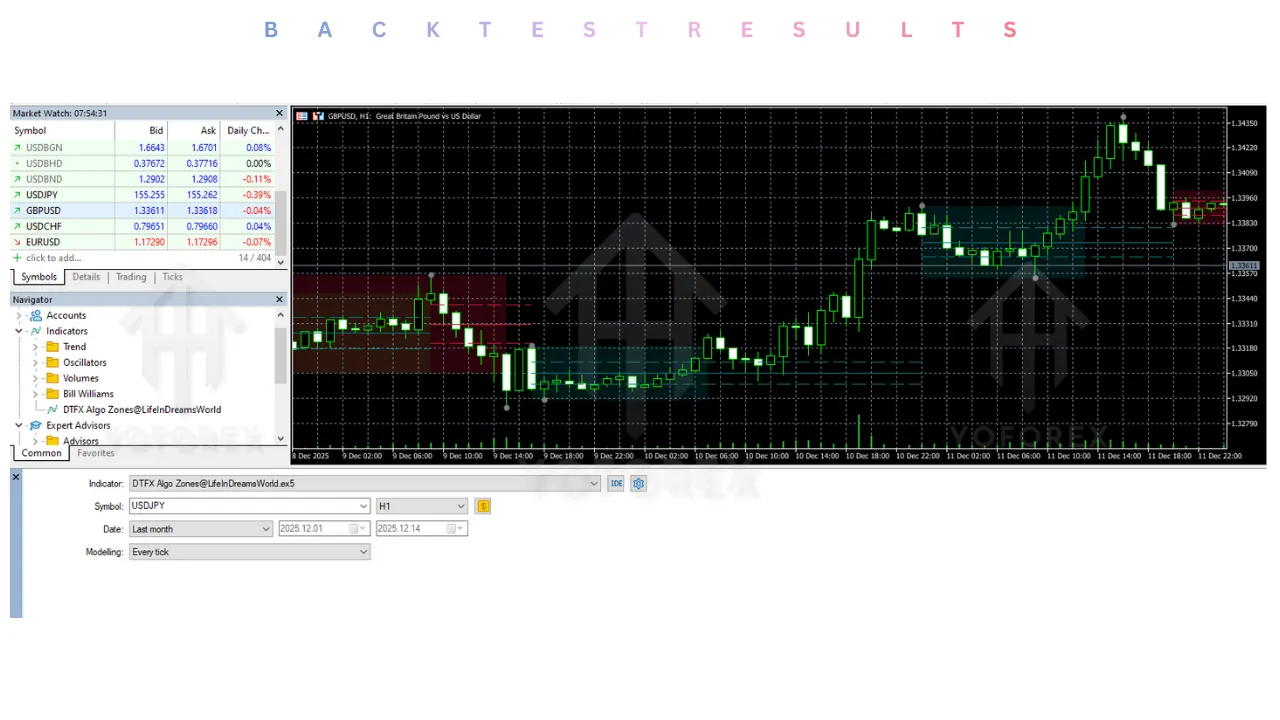
The indicator marks swing highs and lows using visual shapes. A confirmed BOS or CHoCH triggers a new retracement zone.
Step 2: Wait for Price Retracement
Price often moves impulsively after a structure shift. The retracement zones are meant to be used after price pulls back, not immediately.
Step 3: Look for Confirmation
When price reaches one of the retracement levels:
Watch for rejection
Look for lower timeframe confirmations
Align with overall trend bias
A strong bounce supports the validity of the market structure shift. A clean break through the zone may indicate weakness or noise.
Key Features of DTFX Algo Zones Indicator V1.0 MT5
Auto-Generated Fibonacci Zones
No manual drawing required. All retracement zones are calculated automatically based on real structure shifts.
SMC-Based Structure Detection
Uses institutional-style market structure logic instead of lagging indicators.
Configurable Zone Display
Show only bullish zones
Show only bearish zones
Display both simultaneously
Show Last Zones Option
Disable “Display All Zones” and choose exactly how many recent retracement zones to keep visible for a cleaner chart.
Clean-Up Level Overlap
Optimizes overlapping Fibonacci levels across nearby zones, reducing clutter and improving readability.
Up to 5 Custom Fibonacci Levels
Each zone can display up to five Fib levels with:
Custom values
Individual colors
Line styles
Visibility toggles
Visual Swing Point Markers
Swing highs and lows are marked clearly, making structure interpretation easy.
Notification Settings
Receive alerts when new zones are formed or key events occur.
Who Should Use This Indicator?
DTFX Algo Zones Indicator V1.0 MT5 is ideal for:
SMC and ICT traders
Price action traders
Fibonacci-based traders
Day traders and swing traders
Traders who want objective structure-based levels
It works best when combined with confirmation tools such as:
Candlestick patterns
Volume analysis
Lower timeframe structure alignment
Advantages of DTFX Algo Zones Indicator
Eliminates subjective Fibonacci placement
Focuses only on high-importance price zones
Reduces chart noise
Aligns retracements with institutional logic
Highly customizable for different trading styles
Limitations to Keep in Mind
Retracement zones may not appear frequently in ranging markets
Requires patience; not all zones are immediately tradable
Best results come when combined with confirmation strategies
Final Verdict
DTFX Algo Zones Indicator V1.0 MT5 is a powerful and intelligently designed tool for traders who rely on market structure and Fibonacci confluence. By generating retracement zones only after confirmed BOS or CHoCH events, it ensures that traders focus on high-quality, meaningful price levels rather than arbitrary retracements.